
Heat Map and Zone Analysis
HOME ▸ SOLUTIONS ▸ SECURITY SOLUTIONS ▸ HEAT MAP AND ZONE ANALYSISHeat Map and Zone Analysis
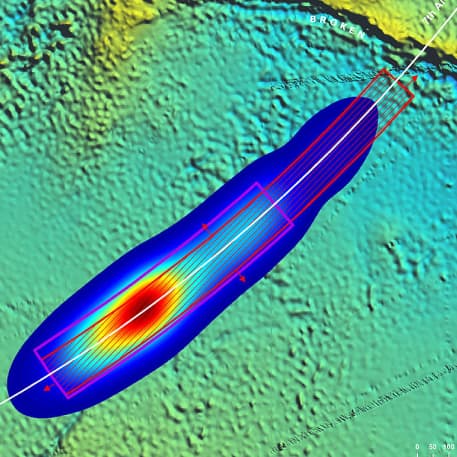
A heat map is a data visualization technique that shows the temperature distribution of a region or subject. It is usually visualized using a color scale, with colors representing different temperature levels. Heat maps are very useful for understanding large amounts of data and identifying trends and patterns. It is also a frequently used tool in geographic information systems (GIS) and data science.
Collaborate with Infinidium!
CONTACT US →Get in Touch
Istanbul — TürkiyeHEADQUARTERS
Maslak Meydan Sok. No:1/67 Beybi Giz Plaza F:32 Sarıyer / Istanbul
+90 212 321 51 71
Ankara — Türkiye
Kızılırmak Mah. 1443. Cad. No:25 Block A F:17 No:123 Çukurambar / Ankara
info@infinidium.com.tr
New York — USA
34-59 Vernon Blvd, Long Island City, NY 11106
info@infinidiumusa.com
Dubai — UAE
Dubai Silicon Oasis, Dubai
info@infinidiumglobal.com